In many laboratories, immunofluorescence staining is almost a standard operation for microscopic imaging. However, some frustrating phenomena are frequently appeared:
Staining, but no visiblesignal ?
CrossChannel ?
Images are blurry, discolored, or the autofluorescence overwhelms the signal?
These issues are often not due to the antibodies themselves, but because — you have not properly understood excitation and emission wavelengths!
Don’t worry, in the next few minutes, we’ll clarify this, and understanding it will save you 80% of the trouble.
01 What Are "Excitation Wavelength" and "Emission Wavelength"?
Fluorescence is one type of photoluminescence, meaning that materials emit light after absorbing light or other electromagnetic radiation. When exposed to ultraviolet radiation, many substances will emit visible light (fluorescence). The color of the emitted light depends on the chemical composition of the substance. Fluorescent materials typically stop emitting light almost immediately once the radiation source is removed. This distinguishes them from phosphorescent materials, which continue to emit light for a period of time after the radiation source has been stopped. This difference in duration is the result of quantum spin effects.
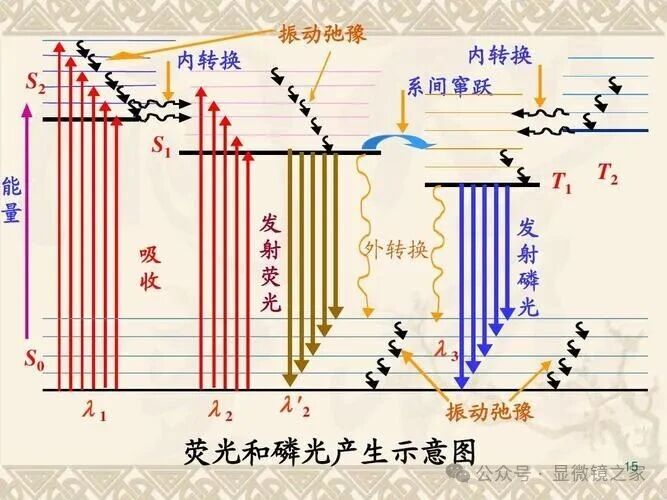
Figure 1: Schematic of Fluorescence and Phosphorescence Generation
When a molecule in its ground state (referred to as S0) is excited by light, it can enter multiple excited states (S1, S2, S3, …). According to the Franck-Condon principle, these higher excited states are different vibrational energy levels. These vibrational excited states usually quickly decay to S1, and then undergo a radiative transition to the ground state or a vibrational level close to the ground state. This transition is called fluorescence. Another de-excitation route is the intersystem crossing from S1 to the triplet state T1. Decay from T1 to S0 is usually slower and of lower intensity, known as phosphorescence.
In one sentence:
Fluorescent molecules first “absorb light” (excitation), then “emit light” (emission).
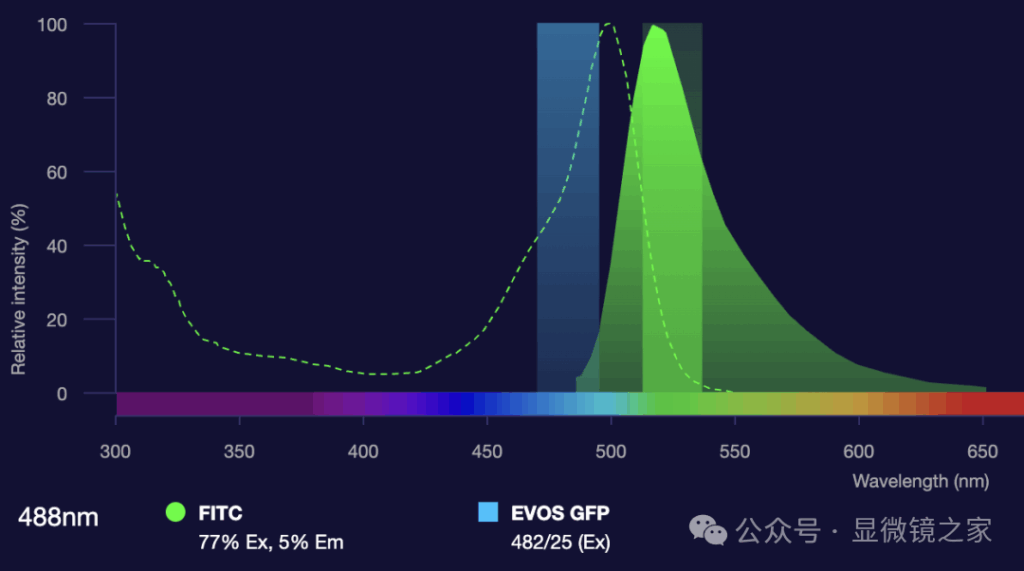
Excitation Wavelength (Ex), indicated by the green dashed line: The wavelength of the light used to “activate” the fluorescent dye.
Emission Wavelength (Em), indicated by the green solid line: The light emitted by the dye after excitation, which is captured by the microscope as the signal.
Fluorescence Excitation Rules:
Mirror Image Rule:
For many fluorophores, the absorption spectrum is the mirror image of the emission spectrum, known as the mirror image rule.
Stokes Shift:
Typically, the wavelength of the fluorescence emission is longer (lower energy) than the excitation wavelength, a phenomenon called the Stokes shift. This is caused by energy loss between the absorption and re-emission of the photons.
02 Different Dyes Should Not Be "Randomly Combined"
Before starting your experiment, you must confirm three critical points:
✅ 1. The Excitation/Emission Peaks of the Dye
荧光染料
激发峰(Ex)
发射峰(Em)
常见通道
DAPI
358 nm
461 nm
405通道
FITC/Alexa488
495 nm
519 nm
488通道
TRITC/Cy3
550 nm
570 nm
561通道
Alexa594
590 nm
617 nm
594通道
Cy5/Alexa647
650 nm
668 nm
640通道
If the fluorophore, excitation, and filters do not match, your efforts will be in vain!
✅ 2. Does Your Microscope Have the Corresponding Laser/Light Source?
How many light sources are in your system? Does it support 405/488/561/594/640 nm, etc.?
✅ 3. Are the Optical Filters Compatible?
Excitation Filter (Ex): Used to select and pass specific excitation light wavelengths that can activate the fluorescent molecules.
Emission Filter (Em):Used to filter the emitted fluorescence signal, passing only the desired emission wavelengths while blocking the excitation light and background noise.
Dichroic Mirror: Positioned at the intersection of the excitation and emission light paths, it selectively reflects excitation light while transmitting emission light, thus separating the two pathways.
These three elements must all match the dye’s wavelength range, or no matter how bright your signal, it won’t reach the detector!
03 The Source of "Color Crosstalk": Overlapping Emission Spectra
If you combine:
TRITC (orange emission)
5 (deep orange emission)
Congratulations, your image will likely turn into a “colorful abstract,” because their emission spectra are too close, and the filters cannot block the overlap.
✅ Solution:
Try to select dyes with larger spectral separation (e.g., DAPI + Alexa488 + Alexa594 + Alexa647).
Or, use sequential scanning, spectral detection, or linear unmixing (Spectral Unmixing).
04 Why Does Signal Intensity Vary So Much with the Same 488 nm Excitation?
Factors affecting intensity include:
Light source power (Mercury lamp / LED / Laser)
Dye quantum yield (Alexa > FITC > Cy3)
Sample thickness
Autofluorescence (from tissue/cell background)
For instance, if there’s high green background autofluorescence in tissue sections, avoid using FITC and opt for red-shifted dyes like Alexa594 or Alexa647 instead.
05 How to Select Dyes & Channels for Your Experiment?
Three steps to get it right:
✅ 1. Clarify the Target and Antibody Source
For example, mouse primary antibody + donkey secondary antibody → Choose a donkey anti-mouse fluorescent secondary antibody. (The primary antibody is produced in mice and identifies the target antigen; the secondary antibody, produced in donkeys, specifically binds to mouse IgG and is labeled with a fluorophore. This ensures signal amplification and avoids cross-reactivity between homologous antibodies, resulting in clean and specific fluorescence signals.)
✅ 2. Check Your Microscope System Parameters
Your system:
What excitation sources are available? (This determines the range of dyes you can use)
What emission filters are available? (This affects signal separation and imaging purity)
Are the filters narrowband? Wideband? Multi-channel simultaneous acquisition? (This impacts the resolution of multi-color imaging and the risk of crosstalk)
✅ 3. Avoid the "Death Triangle"
❌ Mismatched Excitation Sources — Excitation wavelengths fail to activate fluorescent molecules, resulting in weak signals.
❌ Overlapping Emission Spectra — Emission peaks of different dyes overlap, causing signal crosstalk and false positives.
❌ Strong Background Interference — Environmental or autofluorescence signals enter the detection range, reducing image contrast.
06 The Often Overlooked Key Factor: Sample "Thickness" and Refractive Index
Tissue Sections/Organoids:Use far-red dyes + confocal/multiphoton for best results.
Monolayer Cells/Adherent Cells: Use common dyes like FITC (488 nm) or Alexa594 (561 nm) + widefield/confocal.
Deep Tissue Imaging: Use near-infrared (NIR) dyes + refractive index matching for better imaging.
✅ Summary:
Immunofluorescence is not as simple as “stain it and take a picture.” Excitation wavelength is about “choosing the right light source,” Emission wavelength is about “getting the signal back,” Filters act as the “gatekeeper,” The microscope system is the “traffic hub.” Only when all these elements align correctly can you truly “see what you want to see.” Otherwise, it’s not that you stained it wrong, but rather, you never truly “excited” it.