

Tumor organoids are valuable models for studying drug response in three-dimensional cultures. However, interpreting organoid IC50 results can be challenging. Drug penetration through 3D structures may contribute to heterogeneous responses, while a single endpoint measurement cannot show how organoids change throughout treatment.
Combining time-lapse imaging with quantitative analysis adds visual context to dose–response results.
In this application study, colorectal cancer organoids were monitored over 72 hours using the MSHOT MCS31 Live Cell Imaging System, combining label-free brightfield observation with morphology-based IC50 analysis.
Label-Free Organoid Imaging and Analysis
MCS31 brings together long-term observation and image analysis to support organoid drug-response studies.
Label-free time-lapse imaging
Brightfield imaging records changes in organoid size, shape and structural integrity without fluorescent labeling. Repeated observation allows researchers to follow the same culture during drug exposure.
Morphology-based IC50 analysis
The analysis workflow uses weighted morphological parameters to generate a response score, fit dose–response curves and produce an analysis report. The resulting IC50 should be interpreted according to the selected image-derived metric and assay conditions.
Z-stack acquisition and image fusion
Multi-plane acquisition and image fusion help visualize organoids at different focal depths. With suitable acquisition settings and reliable object identification, time-lapse analysis can also support individual organoid tracking.
Observing Organoid Changes Over Time
The accompanying brightfield videos show how organoid morphology changes during the recorded observation period.
Video 1: Organoid Enlargement and Structural Retention
In the B2 sequence, several organoids progressively increase in projected size, while many maintain rounded outlines and recognizable structures.
These observations illustrate how repeated imaging can reveal changes that are difficult to assess from an endpoint image alone.
Video 1. Representative brightfield time-lapse sequence from well B2, showing changes in organoid size and morphology.
Video 2: Changes in Organoid Structural Integrity
In the C9 sequence, some organoid structures develop irregular outlines and a more granular or fragmented appearance over time.
The sequence provides visual context for evaluating treatment-associated morphological changes. These features should be distinguished from direct measurements of cell death.
Video 2. Representative brightfield time-lapse sequence from well C9, showing changes in organoid structure during observation.
The videos represent different groups and drug concentrations. They illustrate distinct experimental conditions rather than a matched comparison of drug sensitivity.
Experimental Results
1. Endpoint Morphological Changes
Representative endpoint images show groups A and B across a drug concentration series.
Group A
At lower concentrations, numerous rounded organoid structures remain visible. At higher concentrations, small fragments and irregular structures are present, while intact organoids can still be observed.
Group B
At higher concentrations, the displayed fields show more extensive structural disruption. At the highest labeled concentration, few intact organoid structures remain visible.
Overall, the endpoint images suggest a stronger morphological response in group B under the tested conditions. Quantitative comparisons require consistent sampling and normalization to account for differences in starting cultures and imaging fields.
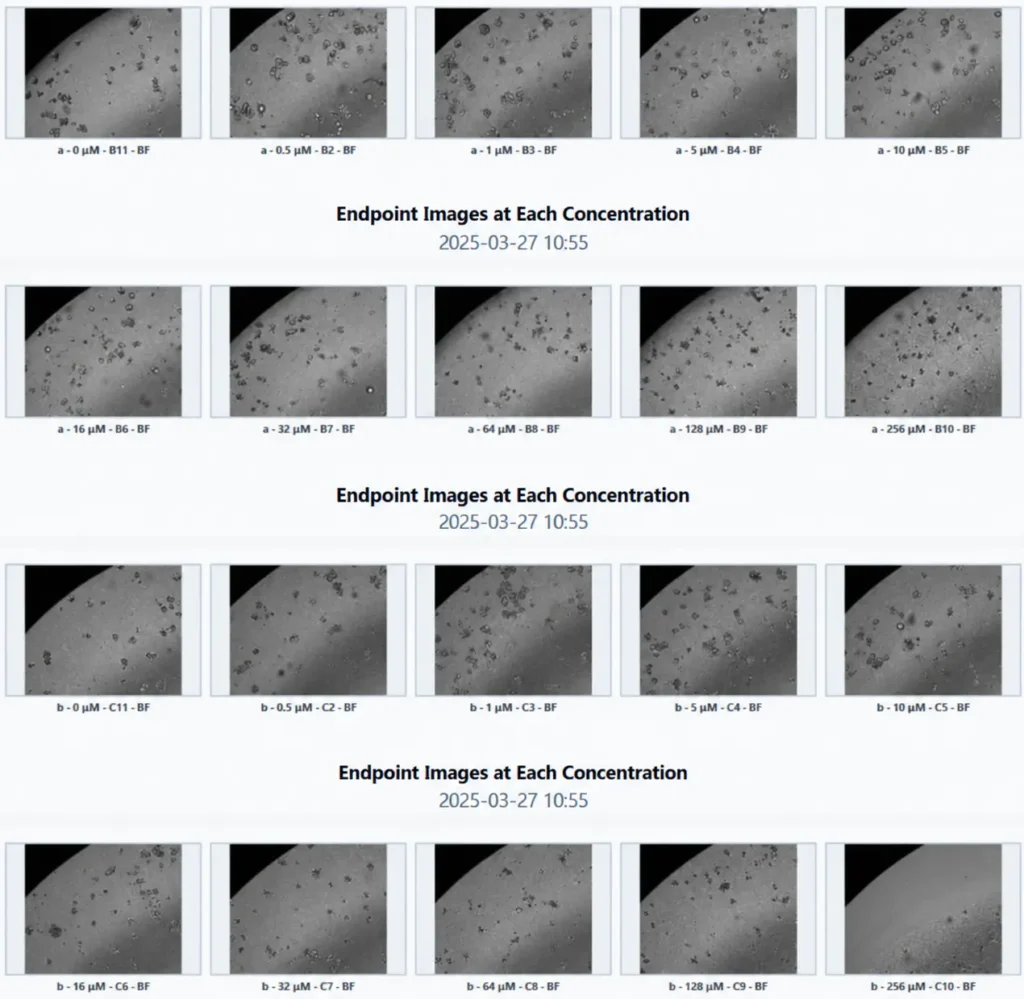
Figure 1. Representative endpoint brightfield images of colorectal cancer organoid groups A and B across concentrations labeled from 0 to 256 μM.
2. Morphology-Based Dose–Response Curves
The fitted curves provide a quantitative summary of the selected morphological response metric.
At lower concentrations, both groups remain close to the normalized control level. At higher concentrations, the curve for group B declines more strongly than that for group A.
The purple curve for group B crosses the 50% reference line, whereas the green curve for group A remains above it over the displayed range.
These results are consistent with a stronger image-derived response in group B. A reliable numerical IC50 comparison requires the underlying analysis output, a clearly defined response metric and an appropriate concentration range.
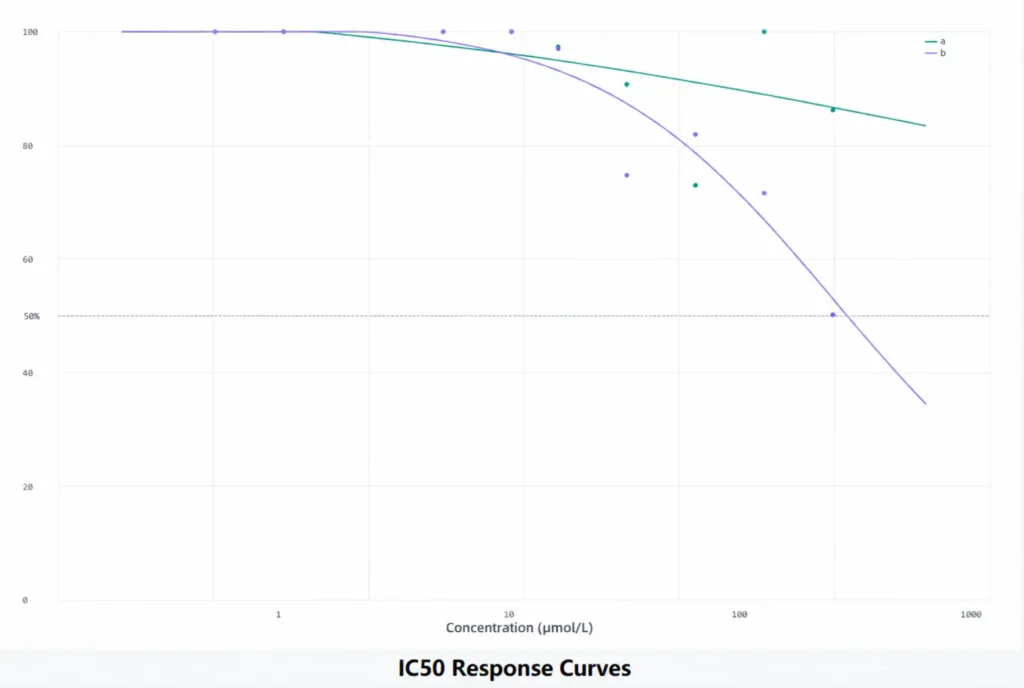
Figure 2. Morphology-based dose–response curves for groups A (green) and B (purple). The dashed line marks the 50% response level.
A morphology-based IC50 describes inhibition of the selected image-derived metric. It should not automatically be interpreted as 50% cell death. Independent viability measurements can help validate the biological meaning of the score.
Connecting IC50 Results with Dynamic Imaging
An endpoint IC50 summarizes drug response at a selected time. Time-lapse imaging helps explain how the observed response developed.
Combining the two allows researchers to examine:
When visible morphological changes begin.
Whether organoids enlarge, retain their structure or become fragmented.
How individual organoids differ within the same culture.
How endpoint morphology relates to the dose–response result.
In this example, the dynamic image sequences add temporal context to the endpoint analysis. Calculating dose–response curves at multiple time points would allow further investigation of how drug response evolves over time.
Applications in Organoid Drug-Response Research
This workflow provides an approach to combining label-free organoid observation with quantitative drug-response analysis.
It can support chemotherapy-response research and may be adapted for targeted therapies, antibody–drug conjugates and organoid–immune cell co-culture studies, with assay-specific validation and complementary measurements.
By connecting image sequences with morphology-based analysis, MCS31 helps researchers investigate both the extent and the progression of organoid responses during treatment.
Explore MCS31 for Your Organoid Research
Planning an organoid drug-screening experiment? Discuss your culture model, imaging schedule and analysis requirements with MSHOT.
Learn more about the MCS31 Live Cell Imaging System
Email: sales@mshot.com
Website: https://www.m-shot.com/product/live-cell-imaging-system-mcs31/